
 April 17, 2012
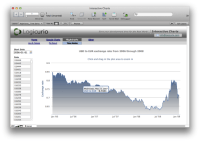
Check out this demo of cool interactive charts by Logicurio. They use an interesting technique with their handling of Javascripts. Instead of writing the file out the drive, they store the .js file in a global field and then throw the text of the .js files into Global Variables on launch.
Define Global text fields to store Javascript files

Paste Javascript text into these Global Fields
On launching the file, they declare those Global fields to Global Variables

Define a set of Global Variables to store these Global Fields full of Javascripts. Have this script run on launching the database.
In a Web Viewer Reference the Javascript Global Variables

Then in the web viewer they use the data:text/html approach, pulling everything into the Web Viewer directly from FileMaker — there is no need to reference any external files. In particular here, they are referencing the .js global variables they created on startup.

The result is a set of very sweet looking graphs with a bit of interactivity or animation and zero footprint on your hard drive. Everything generated comes from elements within FileMaker. I like this approach. It appears that it would be very straight forward to implement. I especially like the chart that handles a large number of data points. I haven’t tried charting with FileMaker 12 yet, but previous versions are a bit lacking with large data sets. This demo is well worth downloading from Logicurio and examining.
Related Articles:
Creating Google Cluster Maps from FileMaker
FileMaker and Image Maps in a Web Viewer


Someone on a LinkedIn group asked why bother with the Global Variable, since you could do the same thing by linking to the Global Field where the Javascript file is stored. My suggestion was it is probably done for speed—presumably accessing a variable in memory would be faster than going to disk for the field storage. Have yet to test this notion.