
 June 13, 2010
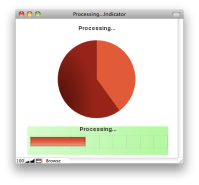
A processing indicator is something that FileMaker has long needed. Various developers have come up with different solutions to this missing feature. With FileMaker 11’s ability to create charts and graphs, finally there is a fairly easy built-in method to doing a processing indicator. What follows is a description of a fairly portable approach to creating a processing indicator. The idea is that you can copy one script and one chart object and be able to paste it into any solution. Minor edits to the script to reference the appropriate layouts and it should just work.

Processing script

Processing divided into 10 steps

Nearly finished…

How it works

1) Go into Layout mode and 2) Double click on the Pie Chart
Pie Chart Setup

Value Data is pulled from two global variables – $$Count and $$FoundCount. We set these in the Loop Thru processing script. By using Global Variables it becomes possible to cut and paste this chart into other solutions.
Note that we are feeding the Value Data from the Current Record (delimited data). What this means is you have to deliver the Value Data in the format:
Number (carriage return)
Number 2 (carriage return)
Number 3 (carriage return)
etc.
With this chart there are just two numbers, the record number we are on and the number of records remaining in the found set.
Click Specify Calculation

Specify Calculation

Because this is a pie chart, the numbers need to be presented in relation to each other. If the Found Count is 100%, then the Count has to be presented in that context. By subtracting the Found Count from the Count we get the pie chart to balance.
Think about 100 records and we are on record 25. By subtracting 25 from 100 you get 75. Even if the numbers are 300 and 25, we get 25 and 275, balancing the pie chart.
The Script

The Loop Thru script describes what the chart will display by setting the two Global Variables $$Count and $$FoundCount
Loop Thru script

1) We go to the layout with the pie chart on it, hide the status area and adjust the window.
2) Then we set the variables.
$$Count is a global variable representing the table row we will be on, when the chart gets updated.
$$FoundCount is the found count of records. This allows us to run the script on different sub sets of data.
$$ModNumber is the frequency with which we will refresh the chart. I have set this to 10 segments. Depending on the size of the data set and the speed of the script running, this number may need to be increased or decreased.
3) The Loop is a fairly standard loop. It starts on the first record, goes to the next record, exiting after last, performing some action on the records in the middle.
4) This is where you would place the action for your script.
5) Increment the $$Count global variable.
6) Because most scripts run quickly and don’t give the interface much feedback, we put in a pause here to refresh the graph. Using the Mod function divides the $$Count variable by a tenth of the $$FoundCount variable. If the result is equal to zero, we know we have a match and can pause.
7) Goes back to the original layout. You might add a Custom Dialog telling the user what has happened.
The script and graph are constructed using Global Variables. In theory, you should be able to copy and paste them into your solution. You will have to modify the Go to Layout Scripts to match your solution layouts.
The Horizontal Bar Chart version

You probably noticed the optional second indicator at the bottom of the page. If you like lines instead of circles, this is the way to go. This horizontal bar chart uses the same global variables to feed it, but is setup slightly differently. Double click the graph to open the Chart Setup window.
Horizontal Bar Chart Setup Window

1) set the Chart Type to Horizontal Bar.
2) Give the chart a title. In this case “Processing…”
3) Name the X Axis.
4) Set the Horizontal Y Axis to $$Count/$$FoundCount*100 to turn it into a percentage.
5) There is one important Formatting requirement, so click on Format Chart…
Formatting Horizontal Bar Chart

Make sure the Set Y-Axis coordinate is set and set the maximum to 100, which will display this bar chart as a percentage.
Download the File Here


Again, a really nice solution to a simple interface shortcoming in FM. Thanks for posting this clever idea.
D